Quant Command Center

A multi-market set of panels running on my own computer. Market collection, indicator calculation, state assessment and discipline reminders all happen locally, without depending on an online service.
Why I built a local tool
Once I entered financial markets, I quickly realized that all my information lived in pieces. Prices were in brokerage apps, indicators were on market websites, and positions were in my own spreadsheet. Checking one thing meant bouncing between four or five places, often long enough to forget what I had wanted to check.
The more interesting problem was that all those apps had one thing in common: they were delighted to parade a dizzying amount of data, but none volunteered to explain the trend hiding behind it. Was the market trending one way or chopping sideways? Was a stock’s sudden surge a bull trap or the start of a real upswing? After a 30% pullback, was it actually cheap enough? If I entered now, where should profit-taking end and the stop-loss begin?
My ambition at the start was not small: I wanted to use historical data and good strategies to discover a guaranteed winning rule. So began an endless cycle of writing a strategy, running it back through old data, rejecting it, adjusting it, and testing it again.
After more rounds of adjustment and backtesting than I can count, I discovered, somewhat despairingly, that there is no financial law that always wins (obvious, in hindsight). I changed the tool’s purpose from “tell me exactly what to buy so I can make a fortune for certain” to this: “It is a cockpit, not an alpha engine. It does not make money for me while I lie back; it helps me see what I am doing, cool down when I am angry, be greedy when I am fearful, wake up when I am greedy, and decide what this particular situation calls for instead of handing the reins to emotion and compounding one mistake after another.” In practice, the latter is much harder, and much more useful.
The crooked path through development
The first strategy died by the rules I wrote.
To stop myself from tuning parameters until a backtest looked flattering, I introduced pre-registration. Before a run, I fixed the acceptance criteria in writing: maximum drawdown, annualized return, and a requirement to beat a random-entry control. No changing them halfway through.
The first moving-average timing strategy marched in confidently and failed all three. A review showed that the famous 2020 crash had landed inside its exit buffer, so it stayed fully invested throughout the fall without moving an inch.
By the rules I had set in advance, I killed it.
Then came the macOS triple hit.
The system insisted on launching Python in x86 mode while my numerical libraries only spoke arm. Putting the project on the Desktop brought a permissions lockout. After one upgrade, a JavaScript engine used by a database dependency acquired a new talent: taking down the entire process in silence. No error, no goodbye. The panel vanished as if aliens had collected it.
Time zones, the programmer’s permanent enemy.
For a while, the Japanese equity panel used U.S. Eastern Time to decide whether Tokyo had completed a trading day. In the early hours in Tokyo, the program remained convinced that “today has not closed,” and refused to fetch yesterday’s closing prices.
Only after one panel covered three markets across three time zones did I properly understand that “today” is a term that needs a definition.
The program did not understand days off.
The first version knew nothing about public holidays. It only knew that Monday through Friday were workdays.
After China’s Dragon Boat Festival and U.S. Independence Day, it studied perfectly normal data and confidently attached a red “stale data” label. It was like a ridiculous employee who came to the office without realizing it was a holiday, found that nobody else had shown up, and angrily reported everyone to the boss.
It later gained a real exchange calendar.
And the refresh button clicked 1,747 times.
For a period, the China A-share panel’s “Refresh now” button did nothing. It flashed “fetching” and immediately returned to normal, as if nothing had happened.
The logs revealed the unpleasant truth: that button had been clicked 1,747 times, and every click had failed.
A full-market snapshot endpoint was being called more than a dozen times in every fetch cycle. A complete refresh took eight minutes, holding the lock throughout. When the front end received a “busy” response, it quietly swallowed it and told the user nothing.
After the fix, a fetch fell from 477 seconds to 42. The button finally learned how to report progress.
The failures were different, but they all pointed to the same lesson:
A tool failing is manageable. A tool failing while pretending nothing happened is not.
Most of the system’s later redesign followed from that rule.
How it is put together
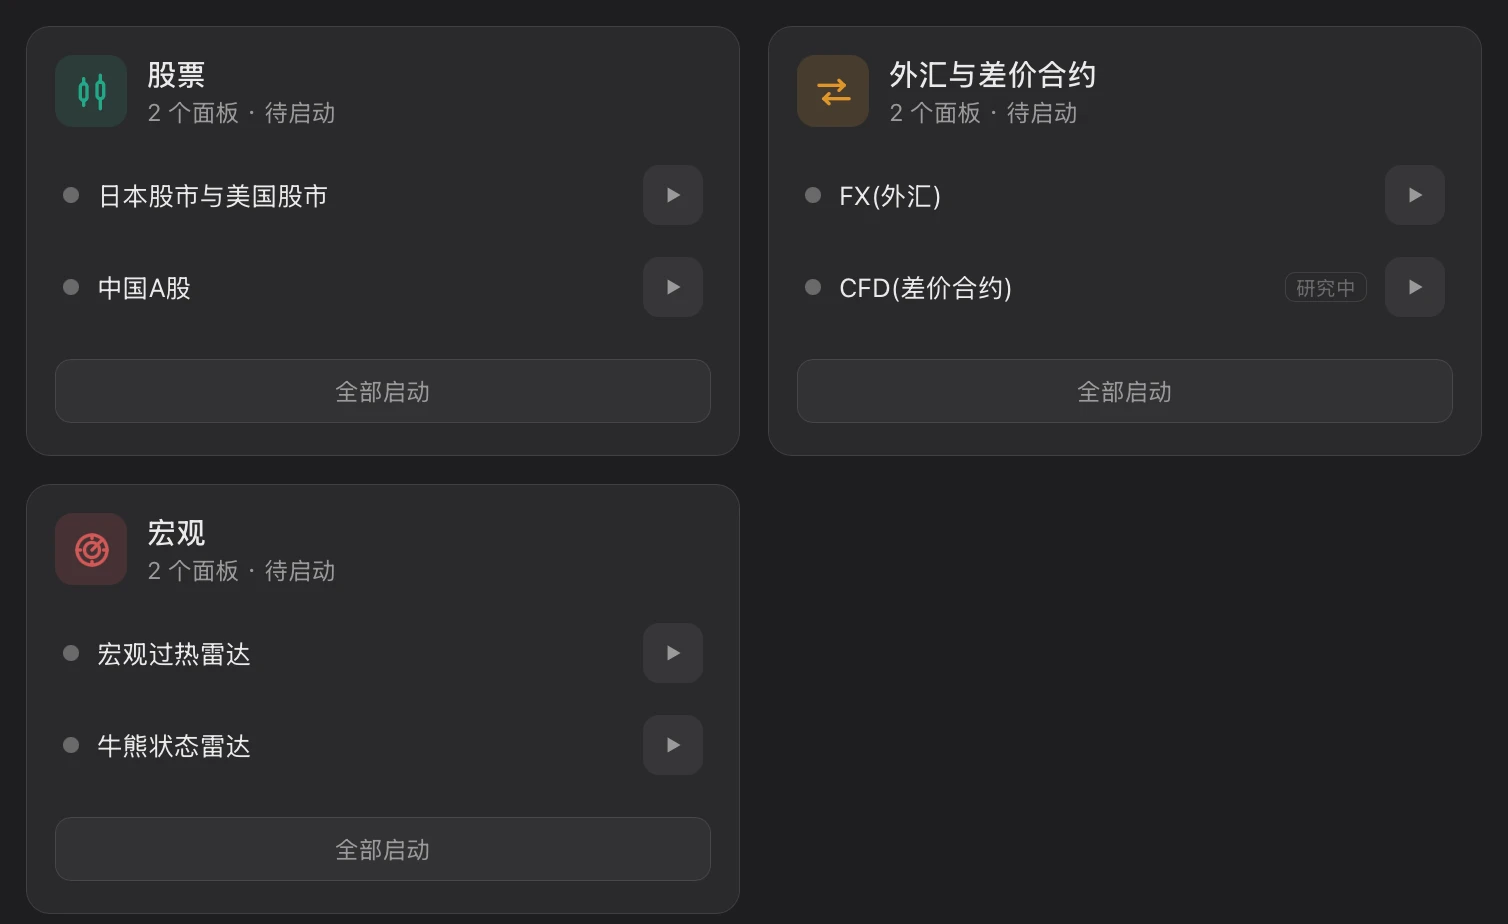
The system consists of one launcher and six independent panels. The panels do not depend on one another and can be started or stopped from the launcher.
Panel structure
Each panel looks after a different market or layer of decision-making.
Japan and U.S. equities
For long-term holdings. It tracks allocation drift and trim prompts, without generating market-timing signals.
Foreign exchange
One currency pair serves as the trading axis; the remaining instruments are monitored only.
Contracts for difference
Decision support for indices, gold, oil and crypto assets, using the broker’s published spreads in the cost model.
Macro heat panel
Brings macro indicators together and expresses the overall environment as a heat reading.
Bull and bear state panel
Combines market structure, macro and narrative with weights frozen in advance. Those weights do not move with the market.
Data collection
- Each market uses free or delayed sources rather than paid real-time feeds. This is a personal tool, and delayed quotes are sufficient.
- Every market has a chain of fallback sources. If the preferred source fails, the system moves to the next and records which one it actually used. A source that repeatedly fails is short-circuited for the current run instead of wasting more time.
- Trading days are determined separately in each market’s local time and checked against real exchange calendars, including holidays and adjusted schedules.
- There are two fetch modes: scheduled collection after each market closes, and a manual forced refresh at any time. Fetches run in a background thread with live progress in the interface. Records are stored instrument by instrument and committed in batches, so completed work survives even if power is lost midway.
- Data lives in a local SQLite database. Slow-changing reference lists are persistently cached; when an API is unstable, the system falls back to an older copy and states that copy’s date.
Every data point carries a freshness state:
- Delayed intraday
- Market closed
- Stale data · Fetch failed
A failed fetch is always made visible.
There is no path in the system that silently presents old data as current.
The local quant logic
This system does not make predictions.
Every calculation serves two purposes: describing the present and enforcing rules decided in advance.
Long-hold logic (Japan and U.S.)
Positions are equally weighted and built through regular contributions. If weight drift crosses a threshold, the system only suggests a reduction (TRIM), not a full rebalance.
A-Share Logic
Entries use momentum—a new 20-day high with volume confirmation, or bullish moving-average alignment confirmed by MACD. Exits obey only the Chandelier trailing stop (a 3×ATR pullback from the relevant high, plus a hard floor); there is no fixed take-profit, so the stop line follows the move. This is the only mechanical discipline in the entire system. Everything else—market-level positioning, sector rotation, peer cross-sections, and the economic calendar—describes the present state without passing judgment. AI interpretation may express a view, but every view is scored at T+5/T+20 against the actual subsequent price performance.
Foreign-exchange logic (USD/JPY)
Because the Hong Kong dollar is pegged to the U.S. dollar, the three currency pairs contain only one genuinely independent direction. I therefore keep USD/JPY as the sole trading axis and relegate the Hong Kong dollar to monitoring only. Position size is worked backward from the risk allocation and stop distance, not from how much margin is available; carry is accumulated day by day, and the remaining distance to forced liquidation is shown explicitly.
CFD logic (cost first)
Calculate the cost before discussing the signal. Each instrument is modeled with the broker’s actual published spread, producing round-trip cost, break-even move and break-even win rate. If the achievable move cannot cover the cost, the instrument is marked directly as untradeable. The market-data source only tells me where the price is; cost is always calculated from the broker’s own book.
State assessment (two radars)
One radar brings macro indicators together and expresses the environment as a heat reading; the other combines three classes of indicator—market structure, macro and narrative—at fixed weights to determine a bull or bear state. The weights are frozen before activation. After that, the radars only report readings; they are not adjusted after the fact.
Strategy admission
Every new strategy must pass a pre-registered backtest before reaching a panel. Acceptance criteria are fixed before data is run. Passing strategies may enter; failures are archived together with the process.
At present, more strategies are archived than admitted. I take that as evidence that the system is doing its job.
Visualization
- All panels are local web pages built with Flask, with the browser as the interface. The launcher is a native window with status lights and one-click controls for each panel.
- Interface elements are designed for rapid state reading: momentum badges, sentiment thermometers, discipline banners and data-freshness labels can all be scanned at a glance.
- Lightweight timed view refreshes are completely separated from data collection. The former only redraw the interface; the latter is the only process that touches the network.
- During a manual refresh, the button displays live progress such as “12/27.” When complete, the view redraws and reports the result. Every failure states its cause on the page instead of silently resetting.